The Impact of Hurricane Sandy, 10 Years Later
Ten years ago, Hurricane Sandy battered the eastern seaboard of the United States, with impacts felt in 24 US states including New York, Virginia, New Jersey, Maryland, Delaware, and Washington DC, becoming the fourth costliest storm in the nation’s history. While a relatively mild Category 2 storm at landfall, the combined effects of wind and flooding from the storm surge earned it the title of Superstorm Sandy.
Sandy became a tropical storm on October 22, 2012, and quickly intensified into a hurricane the next day. On October 24, 2012, Sandy made landfall near Kingston, Jamaica, with winds of 80 mph. Subsequently, it strengthened into a Category 2 hurricane and smashed Haiti, Cuba, and the Bahamas. It reached New York City, its suburbs, and Long Island on October 29, 2012.
The hurricane caused an estimated $81.9 billion in damages. New York City alone suffered economic losses of almost $19 billion. Metropolitan Transportation Authority suffered damages of nearly $5 billion, making it the worst disaster to impact the subway system in its 108-year existence. In the state, there was additional transportation damage of $2.5 billion.
More than 2.2 million individuals faced power outages for several days throughout the country. The storm damaged, and severely flooded around 100,000 homes in Long Island, thousands of homes, and 55,000 buildings in New York. The New York City Subway system, numerous suburban neighborhoods, and all road tunnels were all flooded as a result of Sandy. It also led to the shutdown of the New York Stock Exchange for two consecutive days.
Assessing the Impact
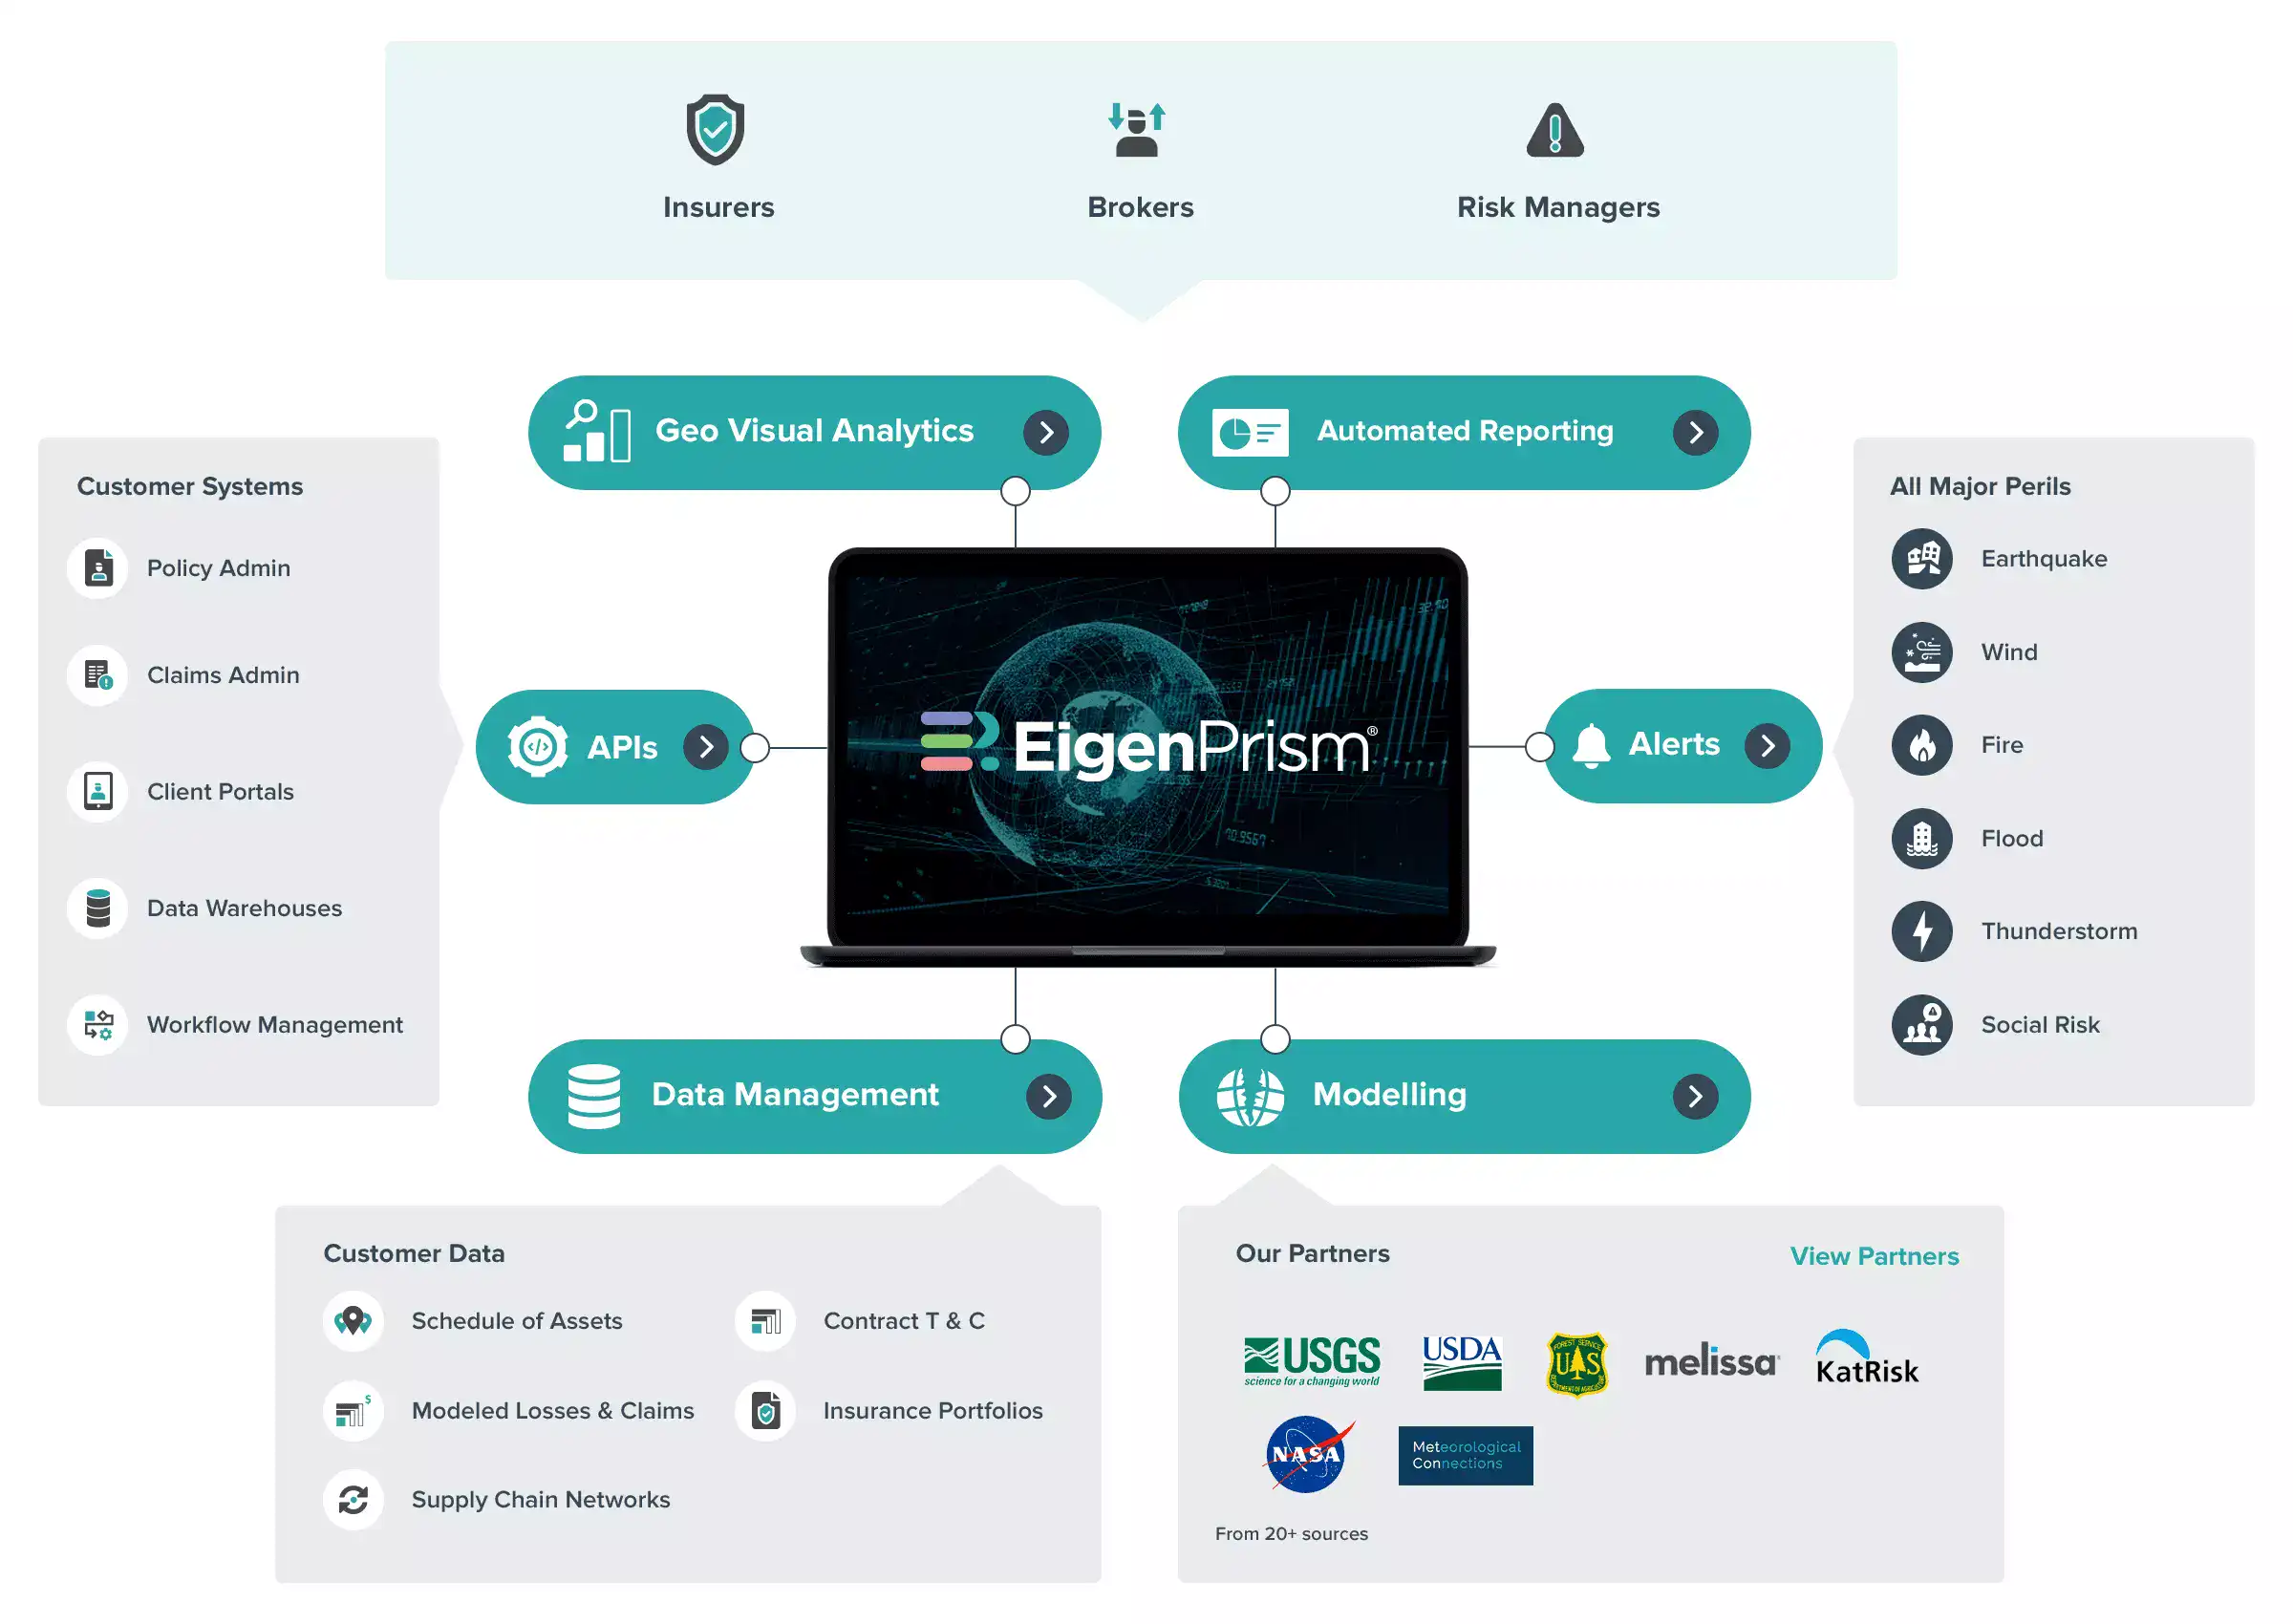
While Superstorm Sandy’s wind damage covered a much larger area than is expected of a hurricane, the event is noteworthy due to extensive flooding caused by extremely high storm surge. It is an excellent benchmark event to use when stress-testing your portfolio, and for what-if scenario analyses. We have compiled a set of relevant footprint links (see below) to assist EigenPrism® users. Links for both v3 and for v4 are provided for your convenience.
EigenPrism® users can overlay the following Hurricane Sandy footprints on their exposure:
- Historical North Atlantic Hurricane Wind Speed Footprint – v3 | v4
- Wind swaths for Tropical Cyclones worldwide – v3 | v4
For subscribers of KatRisk and reask, real-time hurricane footprints on EigenPrism® are available for analysis.
- SANDY 2012 50th Percentile Peak Gust from reask – v3 | v4
- Historical North Atlantic Hurricane Footprint from KatRisk – v3 | v4
- Historical US Hurricane Storm Surge Footprint from KatRisk – v3 | v4
Don’t have access to EigenPrism®?
Sign up for a trial account and access full impact reports of all events. Contact us and we’ll set up a trial account for you.


